Marketing Metrics That Don't Suck
Forget the likes and shares, we're talking about the cold, hard numbers that prove your marketing isn't just a money pit.
Let's be honest, most marketing metrics are rubbish.
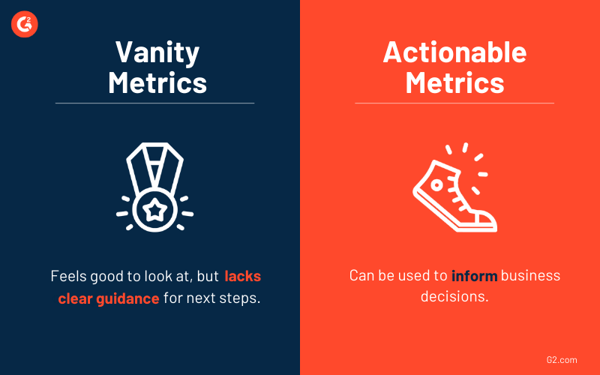
Likes, shares, impressions—they're all vanity metrics that make you feel good but don't actually move the needle.
It's like measuring the size of your biceps when you're trying to win a marathon.
You wouldn't invest in a stock without expecting a return, right?
What you need are metrics that actually matter, metrics that tell you whether your marketing is actually driving revenue and growth.
And that's what we're going to talk about today.
This week:
Alex Hormozi’s Top 3 Marketing Metrics
The Metrics I Think You Should Obsess Over
The Relationships Between Metrics
B2B V B2C Metrics
Stage of Growth Metrics
The Ugly Truth About Metrics
Tools and Recommendations
No-BS Advice
My Final Thoughts
The Rabbit Hole
Alex Hormozi’s Top 3 Marketing Metrics
Alex Hormozi, the guy who's built multiple 8-figure businesses, says you only need to obsess over three metrics. He might not be everyone’s cup of tea, but lets at least take a look at the marketing metrics he claims to live by.
1. Customer Acquisition Cost (CAC)
How much does it cost you to acquire a new customer?
This is the lifeblood of any business. If your CAC is too high, you're essentially burning money.
Calculation: Divide your total marketing and sales spend by the number of new customers acquired.
Example: If you spend $50,000 on marketing and sales in a quarter and acquire 1,000 new customers, your CAC is $50.
2. Lifetime Value (LTV)
How much revenue does a customer generate over their lifetime?
This is the holy grail of customer metrics. The higher your LTV, the more profitable your business.
Calculation: Multiply the average purchase value by the number of purchases per period, then multiply by the customer lifespan.
Example: If the average purchase value is $100, with 2 purchases per year over a 5-year lifespan, the LTV is $1,000.
3. 30-Day Cash
How much money do you make from a customer within the first 30 days?
This is a quick and dirty way to gauge the immediate return on your marketing investment. This might not work for every business model.
Calculation: Divide the total revenue from new customers in the first 30 days by the number of new customers.
Example: If 100 new customers generate $10,000 in their first 30 days, each customer generates $100 in their first 30 days.
Now, A Word of Caution on Mr. Hormozi's Metrics
While these three metrics are powerful, they're not the whole story.
Focusing solely on them can be like driving with blinders on.
You might miss important signals:
Customer Satisfaction: High LTV doesn't mean squat if your customers are miserable.
Market Changes: These metrics don't account for sudden shifts in your industry.
Team Burnout: Pushing too hard for "30-day cash" could exhaust your team.
Long-Term Vision: Sometimes, short-term metrics can cloud your big-picture goals.
Brand Building: These metrics don't capture the value of your brand. And let's face it, a strong brand can be your secret weapon. It can lower your CAC, boost your LTV, and even speed up that 30-day cash. But it takes time and doesn't always show up in the short-term numbers.
However, Hormozi's trinity is a great starting point.
Buy your business isn't a one-size-fits-all situation. You need a metric mix that's as unique as your morning coffee order.
I'm about to share the metrics that keep me up at night (in a good way). These are the numbers that'll make you feel like you've got X-ray vision into your business.
The Marketing Metrics You Should Obsess Over
Marketing Originated Customer Percentage (MOCP)
This is your marketing report card. It tells you how much of your new business comes directly from your marketing efforts.
Low MOCP? Your marketing might be slick, but if it's not driving sales, it's just expensive noise.
Calculation: (Customers from Marketing / Total New Customers) x 100
Example: A fintech startup tracks 100 new customers this quarter. 65 came from their marketing campaigns. MOCP = (65/100) x 100 = 65%. Not bad, but room for improvement. They dig deeper and find their podcast ads are outperforming expectations, while their PPC campaigns are underdelivering. Time to reallocate that budget.
Marketing Qualified Leads (MQL)
Forget quantity; focus on quality.
MQLs are the leads ready to buy. They're the difference between shooting fish in a barrel and fishing in the Dead Sea.
Calculation: No universal formula, but typically based on lead scoring. Assign points for specific actions (e.g., 5 points for downloading a whitepaper, 10 for attending a webinar). Set a threshold (e.g., 50 points) to qualify as an MQL.
Example: A cloud storage provider notices leads who use their free tier for over 30 days and then request a demo convert at 4x the rate of others. They now define MQLs as users meeting these two criteria, helping sales focus on the hottest prospects.
Lead-to-Customer Conversion Rate
If your leads re not closing, either your leads aren't as hot as you think, or your sales team needs a kick in the pants.
Calculation: (Number of New Customers / Number of Leads) x 100
Example: An elearning platform generates 500 leads from a new course launch. 75 convert to paying customers. Conversion rate = (75/500) x 100 = 15%. They A/B test their sales follow-up emails and bump it to 20%. That's a 33% improvement in closing efficiency.
Time to Revenue (TTR)
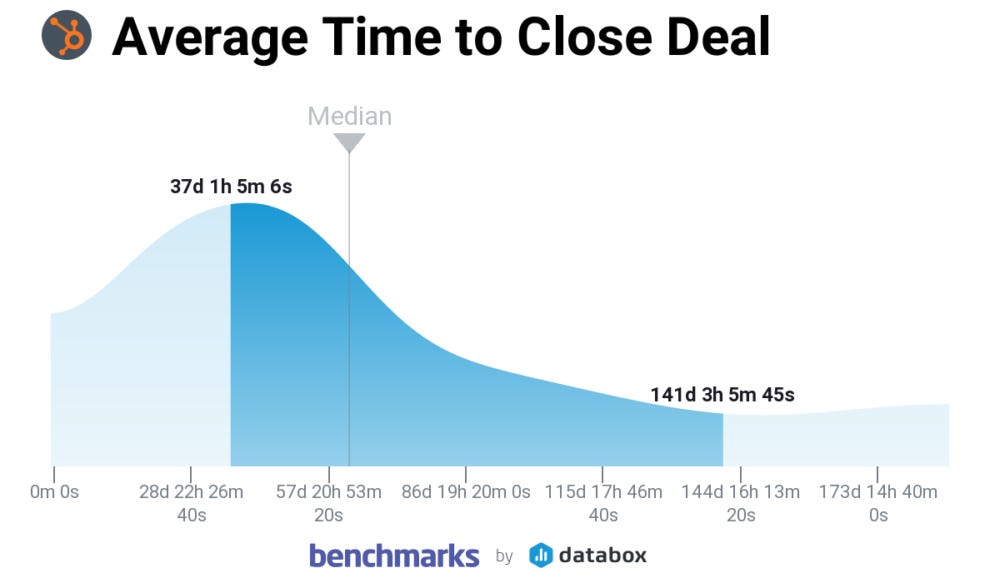
Time to Revenue (TTR) How long does it take to go from "hello" to "cha-ching"?
The shorter, the better. Speed kills in business, and a fast TTR means faster growth.
Calculation: Average (Date of First Revenue - Date of First Contact) for all new customers
Example: A B2B software company's average TTR is 60 days. They introduce a "freemium" model with seamless upgrade path. New TTR: 45 days. That's 25% faster cash in the bank. Their CFO is doing cartwheels.
Sales Cycle Length
Sales Cycle Length Similar to TTR, but focused on the sales process. Find the bottlenecks, grease the wheels, and watch your revenue accelerate.
Calculation: Average (Date of Deal Closed - Date of First Sales Contact) for all won deals
Example: A commercial real estate firm's average cycle is 120 days. They implement a new CRM with automated follow-ups and real-time market data. New cycle: 100 days. That's 20 extra days a year to close more deals.
Gross Margin
The difference between revenue and cost of goods sold. It's your profitability pulse.
Calculation: ((Revenue - Cost of Goods Sold) / Revenue) x 100
Example: A specialty coffee roaster's revenue is $500K with COGS of $300K. Gross margin = 40%. They switch to more efficient roasting equipment, dropping COGS to $250K. New gross margin: 50%.
Retention and Churn Rates
A revolving door of customers is a death sentence.
High retention means happy customers who stick around.
Calculation for Churn: (Customers Lost in Period / Total Customers at Start of Period) x 100 Retention is simply 100% minus your churn rate. ]
Example: A SaaS company starts January with 1000 customers and loses 60 by month-end. Churn = 6%. Retention = 94%. They introduce personalized onboarding, dropping churn to 4%.
Multi-Touch Attribution (MTA)
Multi-Touch Attribution (MTA) This tracks the customer's journey from first touch to purchase. It's like a roadmap showing you where to invest your marketing dollars.
Calculation: Various models exist (linear, time-decay, U-shaped). Example of linear: Divide conversion value equally among all touchpoints.
Example: A D2C fashion brand uses MTA to discover their mix of influencer collaborations, retargeted ads, and abandoned cart emails drives 70% of sales. They double down on these channels, resulting in a 40% boost in conversion rate.
Net Promoter Score (NPS)
Net Promoter Score (NPS), Are your customers singing your praises or cursing your name?
High NPS correlates with organic growth and word-of-mouth referrals.
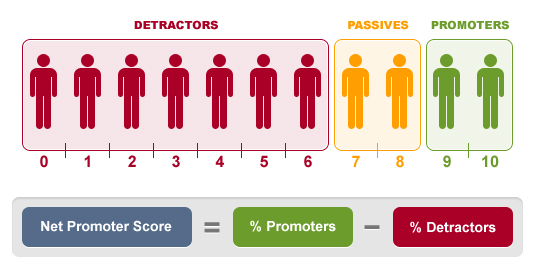
Calculation: % of Promoters (score 9-10) - % of Detractors (score 0-6)
Example: A mobile gaming app surveys 1000 users. 600 are promoters, 300 are passive (score 7-8), 100 are detractors. NPS = (600/1000) - (100/1000) = 50%. They use feedback to improve gameplay, boosting NPS to 65%. Result? 30% increase in organic user acquisition.
The Relationships Between Metrics
These metrics aren't isolated, they're a web of interconnected data points.
Here's how they play together:
CAC and LTV: The dynamic duo. If LTV > 3x CAC, you're in good shape.
MQLs and Conversion Rate: More MQLs should lead to more conversions. If not, your lead scoring needs work.
TTR and Sales Cycle Length: Shortening either of these should positively impact your cash flow.
Retention and NPS: High NPS usually correlates with better retention. If not, you've got a disconnect to address.
Gross Margin and CAC: A healthy gross margin gives you more room to acquire customers. Use it wisely.
B2B vs B2C
B2B and B2C are different beasts, and your metrics should reflect that:
B2B: Focus more MQLs, Sales Cycle Length, LTV. Typically longer sales cycles, higher deal values, relationship-based selling
B2C: Focus more on CAC, Conversion Rates, Retention. Higher volume, lower individual transaction values, emphasis on repeat purchases Think impulse buys and customer loyalty.
Growing Pains
Your metrics priorities shift as you grow:
Startups: You're like a hungry chick, constantly feeding on CAC and MQLs.
Scale-ups: Start focusing more on LTV, Gross Magin and customer retention.
Established businesses: It's all about efficiency and profitability now (like CAC payback period).
The Ugly Truth About Metrics
Metrics are essential, but they're not the whole picture.
Here are some hard truths:
Data can be manipulated. Always dig deeper.
Metrics without context are meaningless. A "good" metric in one industry might be terrible in another.
Over-optimization can lead to short-term thinking. Don't sacrifice long-term growth for quick wins.
Not everything that matters can be measured. Brand loyalty, team morale, and innovation don't always show up in the numbers.
Tools of the Trade
Don't waste time on fluff. Use tools that track the metrics that matter:
HubSpot: For tracking MQLs, sales cycles, and marketing ROI.
Google Analytics: The Swiss Army knife of web analytics.
Qualtrics: Get the unvarnished truth about customer satisfaction.
SEMrush: Own the search landscape and spy on competitors.
Hotjar: See your website through your customers' eyes.
Customer.io: Automate personalized communication to keep customers engaged.
No-BS Advice
Set clear goals for each metric.
"Improve" isn't a goal.
"Increase conversion rate from 15% to 20% in Q3" is.
Present your metrics visually. Dashboards beat spreadsheets every time. Don't cherry-pick. Report the good and the bad. That's how you improve. Revisit your metrics regularly. What worked last year might not work now.
Remember, these are tools, not a religion. If a metric isn't serving you, ditch it.
My Final Thoughts
Marketing isn't about vanity metrics or chasing the latest fads.
It's about building a business that thrives. So ditch the fluff, focus on what matters, and let the numbers guide you to victory.
Remember, these metrics are just a starting point.
The most successful marketers are the ones who constantly experiment, iterate, and adapt. So don't be afraid to challenge the status quo and find the metrics that work best for your business.
Now get out there and start measuring what matters!
The Rabbit Hole - For Those Who Want to Go Deeper
Check out these hand-picked resources:
The Full Alex Hormozi Video on Marketing Metrics
Good Reads
HBR: Do Your Marketing Metrics Show You the Full Picture?: This excellent Harvard Business Review article discusses the importance of using a comprehensive set of metrics to track marketing’s impact on the business.
How Brand Building and Performance Marketing Can Work Together: The authors propose a method for creating metrics that can measure the impact of both brand building and performance marketing on a company's financial performance.
Vanity Metrics: Spotting and Striking Them Out: This article discusses what they are and how to avoid them. Vanity metrics are data points that look good but don't reflect actual success. They can be misleading.
The Ultimate Guide to Your Net Promoter Score (NPS): This is an article discusses what it is and how it is used. NPS can also help businesses predict customer churn.
19 Steps For Measuring Digital Marketing: This article discusses what to track to measure success in a digital marketing campaign. Some important metrics include website traffic, social media engagement, and email click-through rate.


